Frequently Asked Questions (FAQ)
◆Contents
How to Operate
- Q
-
It is unclear to me how to operate the liquefaction potential map.
- A
-
Click "Help" at the upper left corner of the screen for detailed operating instructions.

- Q
-
I want to find a location on the liquefaction potential map by address.
- A
-
You can search by municipality (市[shi]), (区[ku]), (町[machi]), (村[mura]), town, and street (丁目[chome]) from “Address Search” at the upper left corner of the screen. Please note that you cannot search by block number (番[ban]/番地[banchi]).

- Q
-
I want to zoom in or out of the liquefaction potential map screen.
- A
-
You can do so by any of the following:
(1) Select “Zoom In/Out” at the upper left corner of the screen. Then, move the cursor to the vicinity of the destination to specify the range.

(2) Place the cursor on the “Zoom In/Out Tool” at the upper left corner of the screen and slide the cursor up and down.

(3) Place the cursor near the destination and turn the mouse wheel up and down.
- Q
-
I want to display the map information.
- A
-
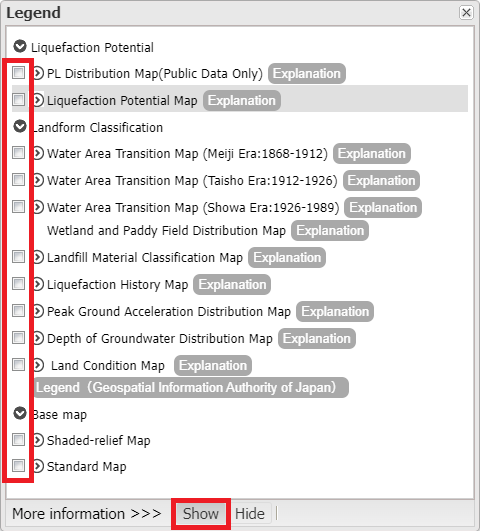
At the upper right corner of the screen, select the map you would like to view from the “Legend” dialog box and click “View.”

- Q
-
I want to print a liquefaction potential map.
- A
-
Click “Print” at the upper left corner of the screen and select the output size. Please zoom in or out before clicking “Print.”

Basis for Liquefaction Potential Map
※ For more information, please refer to the “Mapping of Liquefaction Potential” page.
- Q
-
How do you determine the liquefaction effects?
- A
-
The liquefaction is judged comprehensively based on the liquefaction assessment results from borehole data and liquefaction history as well as other map information.
- Q
-
What earthquakes are assumed in the liquefaction potential map?
- A
-
No specific earthquake is assumed. However, the acceleration of the ground surface is determined from ground waves estimated from waveform records of the 1923 Kanto earthquake which is then used to determine liquefaction.
- Q
-
What is the seismic intensity assumed in the liquefaction potential map?
- A
-
The acceleration (strength of shaking) used to determine liquefaction is an earthquake with an intensity of a little under 6 on the Japanese earthquake intensity scale of 7.
- Q
-
Does the liquefaction history from the 2011 Tohoku earthquake reflect this?
- A
-
In addition to the original survey results at the time of the 2012 revision, the liquefaction history from “Japan Seismic Hazard Information Station (J-SHIS)” published by the National Research Institute for Earth Science and Disaster Resilience is reflected.
- Q
-
How is the liquefaction potential determined?
- A
-
Comprehensive judgment is made on the basis of the assessment results from borehole data and map information.
- Q
-
Why is the liquefaction potential map not displayed (color-coded) in the western part of Tokyo?
- A
-
The western part of Tokyo is excluded because the majority of the area is plateau and hills whereupon the liquefaction potential is low.
- Q
-
The main reason of 2024 revised edition?
- A
-
The reason why is increasing number of boreholes. For details,refer to "approach to liquefaction prediction charts,Section 2.Borehole Data".
Results of the Liquefaction Assessment
- Q
-
If the area color is green (low potential for liquefaction), is there no concern about liquefaction?
- A
-
It can be said that the liquefaction potential is relatively low. However, this liquefaction potential map is only an indication of liquefaction potential which may vary from one place to another even within the same grid square. If you require a detailed liquefaction assessment for a specific location, a detailed survey shall be conducted at your responsibility.
In liquefaction assessment based on borehole data, artificial embankments with no soil material mentioned are considered unlikely to liquefy. However, some embankment materials may increase the possibility of liquefaction. It should also be noted that some soft clay ground in lowlands may not be suitable on its own as foundation ground for buildings.
- Q
-
If the area color is red (high potential for liquefaction), does that mean it will definitely liquefy?
- A
-
The liquefaction potential is relatively high. However, this liquefaction potential map is only an indication of liquefaction potential which may vary from one place to another even within the same grid square. If you require a detailed liquefaction assessment for a specific location, a detailed survey shall be conducted at your responsibility.
The effect of ground improvement is not considered in the assessment of this map. Therefore, in actual cases, ground improvement may ensure safety against liquefaction.
- Q
-
What are the reasons for areas with high potential for liquefaction?
- A
-
The potential for liquefaction tends to be higher in areas with the following ground:
(1) A thick layer of sandy soil has accumulated.
(2) The land conditions have high potential for liquefaction.
(3) There is a liquefaction history.
- Q
-
What is PL?
- A
-
The liquefaction potential index PL is a risk indicator of ground liquefaction. In general, the higher the PL , the greater the potential of liquefaction effects.
- Q
-
Can we determine building hazards from the liquefaction potential map and PL?
- A
-
This map is an index for ground liquefaction and is not for evaluating buildings.
Publication of Data
- Q
-
Does the PL distribution map show all the borehole locations used for liquefaction assessment?
- A
-
Only boreholes by public projects and those with consent that are open to the public are shown.
- Q
-
I want to obtain the borehole data used for mapping of liquefaction potential.
- A
-
Geotechnical surveys conducted by the Tokyo Metropolitan Government and geotechnical information provided by public institutions are available as open data from the “Public Data” page.
- Q
-
I want to see the liquefaction history and other map information used for mapping of liquefaction potential.
- A
-
Map information owned by the Tokyo Metropolitan Government can be selected and displayed on the liquefaction potential map. Open data can also be obtained from the “Public Data” page.
- Q
-
I need a printed liquefaction potential map provided.
- A
-
We do not provide printed material, please output from our website.
Others
- Q
-
I am unable to open the liquefaction potential map.
- A
-
There is a possibility that the line is congested or the system is undergoing maintenance. Please allow some time before trying again.
If you still cannot connect, please contact us at the contact information below.
- Q
-
I want to view the liquefaction potential map on a device other than a computer.
- A
-
The liquefaction potential map is designed to be viewed on a computer. However, it can also be viewed on Internet-capable devices (e.g., smartphones and tablets).
- Q
-
Who is the contact person for inquiries?
- A
-
Tokyo Metropolitan Public Corporation for Road Improvement and Management ,Civil Engineering Section, Road Dept.
TEL. 03-5683-1533

