Mapping of Liquefaction Potential
◆ Contents
◆ Contents
1.Investigated Area
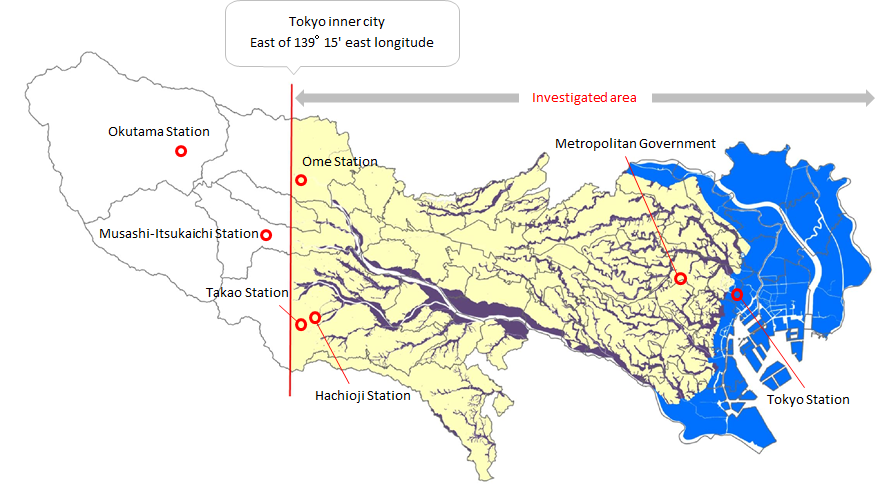
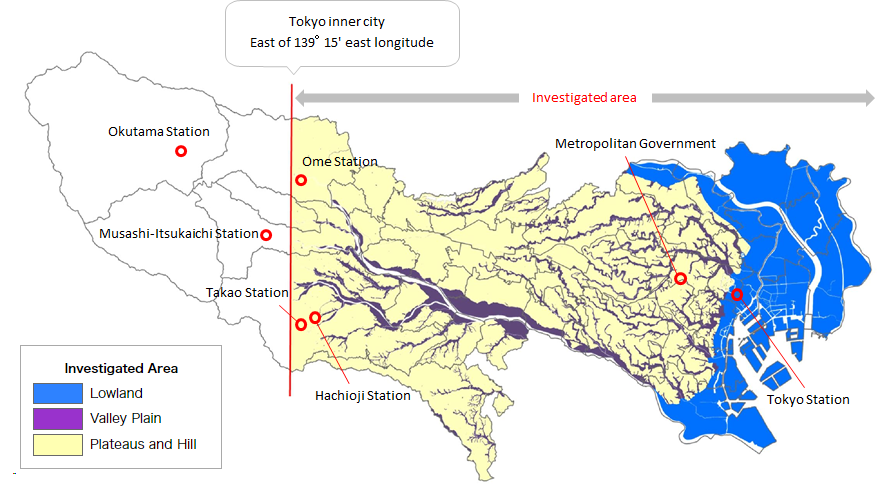
The area east of 139°15' east longitude, where the ground meets the conditions below, is investigated. In fact, liquefaction is reported to have occurred in this area during the 1923 Kanto and 2011 Tohoku earthquakes. In contrast, the area west of this location is excluded from the investigation since it is comprised of mainly mountains where loose sandy deposit are few and no liquefaction has been reported during past earthquakes.
- Lowlands (including reclaimed land along the waterfront)
- Valley plains (distributed to plateaus and hillsides where there are partly loose sandy deposits by erosion of small-medium-sized rivers)
This study excludes the area west of 139°15' E longitude because i) Most of that area is plateaus and hillsides, which means it's unlikely to experience liquefaction, ii) Only a small portion of that area meets the above conditions for liquefaction risk, iii) There haven't been any reports of liquefaction happening there before.
| Investigated Area | |
|---|---|
| Lowland | |
| Valley Plain | |
| Plateaus and Hill | |
Figure 1 Investigated area of the liquefaction potential map
2.Borehole Data
About 83,000 boreholes collected by the Tokyo Metropolitan Government are used.(Approximately 76,000 boring data in the 2022 revised edition)
3.Depth of Groundwater
Groundwater depths are evaluated based on the following:
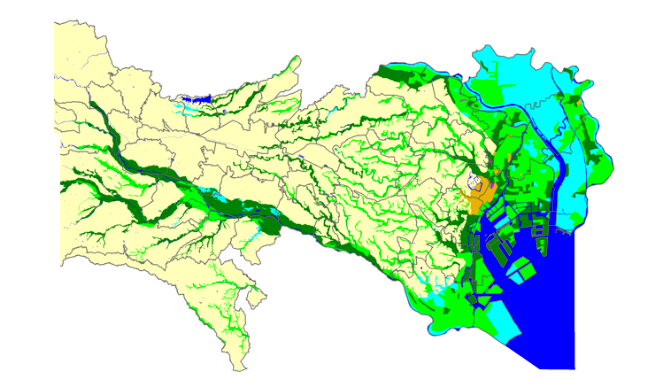
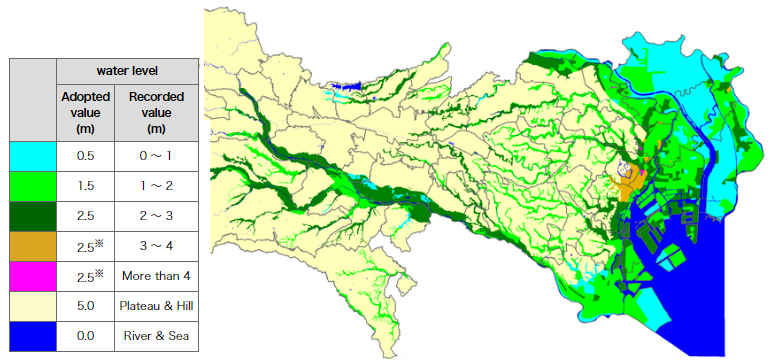
- Depth of groundwater distribution map (Figure 2)
- If the depth of groundwater in the borehole data is shallower than that shown in Figure 2, the depth in the borehole data is used.
- Groundwater depth of 5 m for plateaus and hillsides and 0 m for river and sea are adopted.
- For the depth of groundwater is closely influenced by rainfall, average depth based on survey data is set in liquefaction calculation. And, in case the survey data is from 3 to 4m or more, it is set always 2.5m so as to consider the risk of liquefaction as it more easily happens.
| water level | ||
|---|---|---|
| Adopted value (m) |
Recorded value (m) |
|
| 0.5 | 0 ~ 1 | |
| 1.5 | 1 ~ 2 | |
| 2.5 | 2 ~ 3 | |
| 2.5※ | 3 ~ 4 | |
| 2.5※ | More than 4 | |
| 5.0 | Plateau & Hill | |
| 0.0 | River & Sea | |
Figure 2 Depth of groundwater distribution map
4.Evaluation of Peak Ground Acceleration (PGA)
The assessment of liquefaction effects is conducted by considering ground motion during the 1923 Kanto earthquake. The seismic motion at the engineering seismic base layer is assumed to be identical in the whole area.
◆ (1) Peak Acceleration at Engineering Seismic Base Layer
The peak acceleration at the engineering seismic base layer during the 1923 Kanto earthquake is evaluated to be 200 cm/s2 which is back-calculated from the earthquake record obtained at Tokyo Imperial University (presently, University of Tokyo).
◆ (2) Peak Ground Acceleration (PGA)
The PGA is calculated as follows.
- Ground models for calculations are prepared for each site based on 300 borehole data in areas with the potential for liquefaction.
-
Seismic motions※ are input to the engineering seismic base layer of the ground model, and the PGA is calculated using seismic response analysis.
-
The PGA obtained from the seismic response analysis depends on the ground amplification characteristics and the frequency characteristics of the input seismic motion.
Considering these points, the input seismic motion is based on the following three waveforms observed in the past and adjusted to PGA of 200 cm/s2 on the engineering seismic base layer.
・Hachinohe Port (NS component) during the 1968 Tokachi-oki earthquake
・Port Island at GL-83 m (NS component) during the 1995 Hyogoken-Nanbu earthquake
・K-NET Shinjuku (NS component) during the 2011 off the Pacific coast of Tohoku Earthquake
-
The PGA obtained from the seismic response analysis depends on the ground amplification characteristics and the frequency characteristics of the input seismic motion.
Considering these points, the input seismic motion is based on the following three waveforms observed in the past and adjusted to PGA of 200 cm/s2 on the engineering seismic base layer.
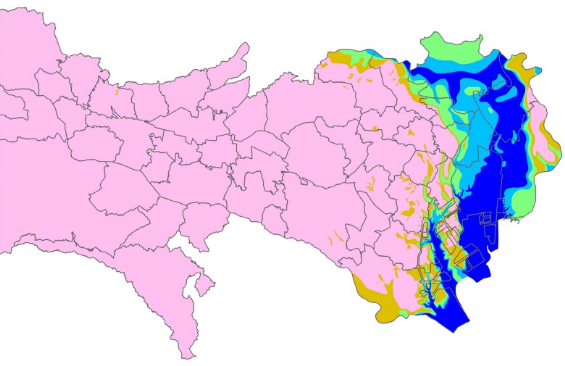
- The PGA is the maximum value calculated for the three types of waveforms. The average value of the PGA is used for each of the five regions classified by the thickness of the alluvium (Refer to the Figure 3).
The thicker the soft alluvium, the lower the PGA and the higher the peak velocity. Considering these points, the PGA is divided into five regional categories according to the thickness of the alluvium. This tendency agrees with past experience; the damage to wooden structures during the 1923 Kanto earthquake is more severe as the Holocene deposit thickness became wider, while the damage is proportional to PGV.
The instrumental seismic intensity (Japanese Meteorological Agency) is 6-, which is nearly equal to the intensity 9 of the Modified Mercalli Intensity scale.
| Peak Ground Acceleration (PGA) (cm/s2) |
Peak Ground Velocity (cm/s) |
Instrumental Seismic Intensit | |
|---|---|---|---|
| 314 | 47.3 | 5.5(6-) | |
| 280 | 51.8 | ||
| 255 | 58.4 | ||
| 243 | 60.3 | ||
| 232 | 65.6 |
Figure 3 Peak ground acceleration distribution map
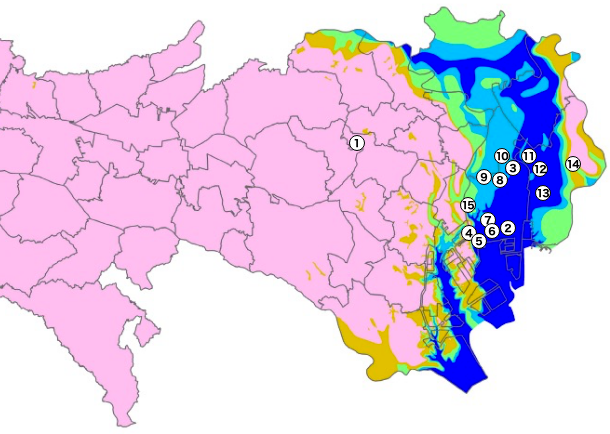
Table 1 Comparison of peak ground acceleration setting values and observed values during the 2011 Tohoku earthquake
| Site | Observed Values during the 2011 Tohoku earthquake (cm/s2) | Calculated from 200 cm/s2 at seismic base layer (cm/s2) | |
|---|---|---|---|
| ① | Shinjuku | 192.4 | 314 |
| ② | Sunamachi | 140.8 | 232 |
| ③ | Kameido | 131.0 | 232 |
| ④ | Shinonome | 161.0 | 232 |
| ⑤ | Tatsumi | 218.9 | 232 |
| ⑥ | Hachieda | 250.1 | 232 |
| ⑦ | Shiohama | 143.5 | 232 |
| ⑧ | Sarue | 164.2 | 243 |
| ⑨ | Yokoami | 183.7 | 243 |
| ⑩ | Yahiro | 141.1 | 243 |
| ⑪ | Okudo | 133.3 | 232 |
| ⑫ | Shinozaki | 159.0 | 232 |
| ⑬ | Ukita | 162.2 | 232 |
| ⑭ | Mizue | 212.4 | 280 |
| ⑮ | Etchujima | 195.1 | 255 |
Figure 4 Peak ground acceleration observation point during the 2011 Tohoku earthquake
5.Flow of Liquefaction Potential Assessment
Figure 5 shows the flow of the liquefaction potential assessment.
(Click the boxes below to see the explanation of each section.)
6. Assessment of Liquefaction Effects by
the Liquefaction Resistance Factor FL
and the Liquefaction Potential Index PL
The assessment is performed for the borehole survey locations. First, the liquefaction resistance factor FL of each location is calculated. Then, the liquefaction potential index PL is calculated based on the FL. Finally, the potential of liquefaction effects at the ground surface is ranked according to the PL.
7.Assessment of Liquefaction Effects
Based on Map Information
Liquefaction assessment is conducted using the following maps:
- (1) Liquefaction History Map
- (2) Land Condition Map
- (3) Water Area Transition Map
- (4) Wetland and Paddy Field Distribution Map
- (5) Landfill Material Classification Map


8.Overall Judgment of the Assessment
of Liquefaction Effects
The liquefaction potential of each grid square is based on two assessments: the liquefaction potential index PL and map information.

9.Presentment of Liquefaction
Potential
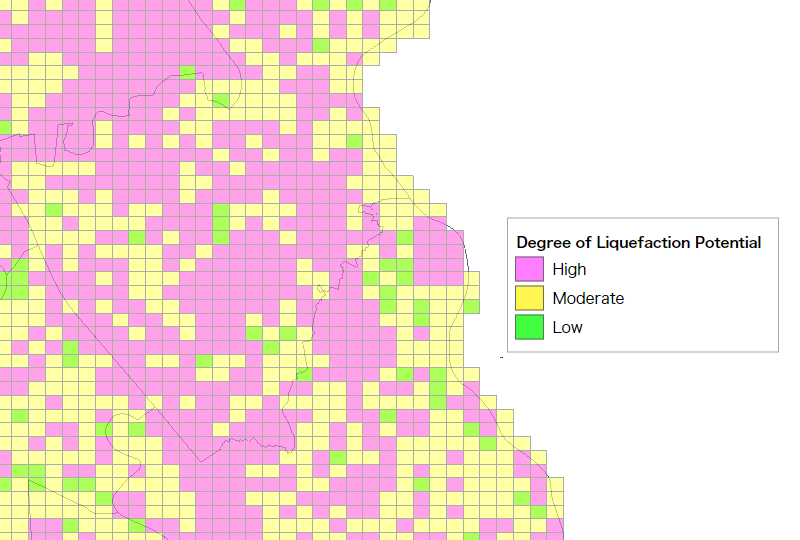
The degree of liquefaction effects at the ground surface in the map is classified into three categories: High, Moderate, and Low.
Figure 5 Flow of liquefaction effects potential mapping
6.Assessment of Liquefaction Effects by the Liquefaction Resistance Factor
FL and the Liquefaction Potential Index PL
Assessment of liquefaction effects based on the borehole data is performed according to the method indicated in SPECIFICATIONS FOR HIGHWAY BRIDGES.The assessment method is as follows.
|
SPECIFICATIONS FOR HIGHWAY BRIDGES : PART V SEISMIC DESIGN Japan Road Association(March 2017) |
|
|---|---|
| Soil Layer Subject to the Assessment of Liquefaction Effects |
|
| Method of the Assessment of Liquefaction Potential |
The liquefaction resistance factor FL is calculated by the following equation:
FL=R/L If FL < 1.0, it is regarded as soil layer with liquefaction potential. |
| Method of Dynamic Shear Strength Ratio, R |

 (For Type Ⅰ Earthquake Ground Motion)

 (For Type Ⅱ Earthquake Ground Motion)
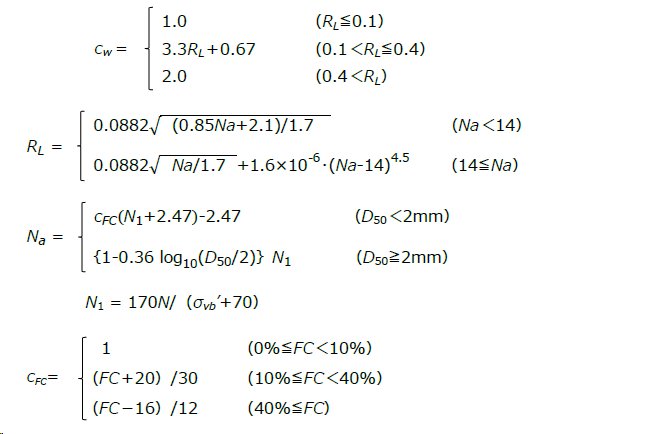
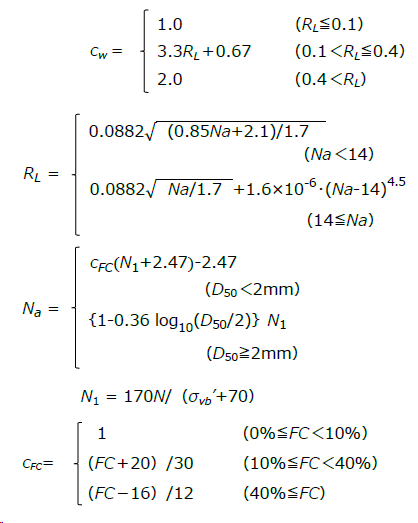 Where,
FL:Liquefaction Resistance Factor R:Dynamic Shear Strength Ratio L:Seismic Shear Stress Ratio cw:Modification Factor on Earthquake Ground Motion
N:N value obtained from the standard penetration test N1:Equivalent N value corresponding to an effective overburden pressure of 100 kN/m2 Na:Modified N value taking into account the effects of grain size σvb’:Effective overburden pressure at depth from the ground surface level where a standard penetration test is conducted (kN/m2) cFC:Modification factors of N value on fine content (FC) FC:Fine content (%) (percentage by mass of fine soil passing through the 75 μm mesh) D50:Mean grain diameter (mm) |
| Method of Seismic Shear Stress Ratio, L |
 Where, rd:Reduction factor of seismic shear stress ratio in ter.ms of depth khgL:Design horizontal seismic coefficient at the ground surface is used to assess liquefaction (rounded to two decimal places)
σv’:Effective overburden pressure at depth x from the ground surface (kN/m2) x:Depth from the ground surface (m) |
| Method to Obtain Liquefaction potential Index, PL※ | ||||||||
|---|---|---|---|---|---|---|---|---|
The occurrence of liquefaction below GL -20 m is considered to be hardly affected by damage to the structure. Therefore, to evaluate the degree of liquefaction effects at the ground surface, the liquefaction index PL is obtained by multiplying the FL shallower than 20 m by a weight function (w = 10 - 0.5z) in the depth direction: Where, FL:Liquefaction Resistance Factor (FL=1 if FL≧1) z:Ground Surface Depth (m)
※ Iwasaki, Tatsuoka, Tokida, Yasuda: A Practical Method for Assessing Soil Liquefaction Potential Based on Case Studies at Various Sites in Japan, Proceedings of the 5th Japan Earthquake Engineering Symposium, pp.641-648,1978.
|
7.Assessment of Liquefaction Effects Based on Map Information
The liquefaction effects are comprehensively evaluated based on five types of map information related to liquefaction occurrence (Table 2).
Table 2 List of map information used for assessment
| Map Information | ||||||
|---|---|---|---|---|---|---|
| ①Liquefaction History Map |
②Land Condition Map |
③Water Area Transition Map |
④Wetland and Paddy Field Distribution Map |
⑤Landfill Material Classification Map |
||
| Potential of Liquefaction Effects | High |
|
|
|
|
|
| Moderate | - |
|
|
- |
|
|
| Low | - |
|
- | - |
|
|
◆ (1)Liquefaction History Map
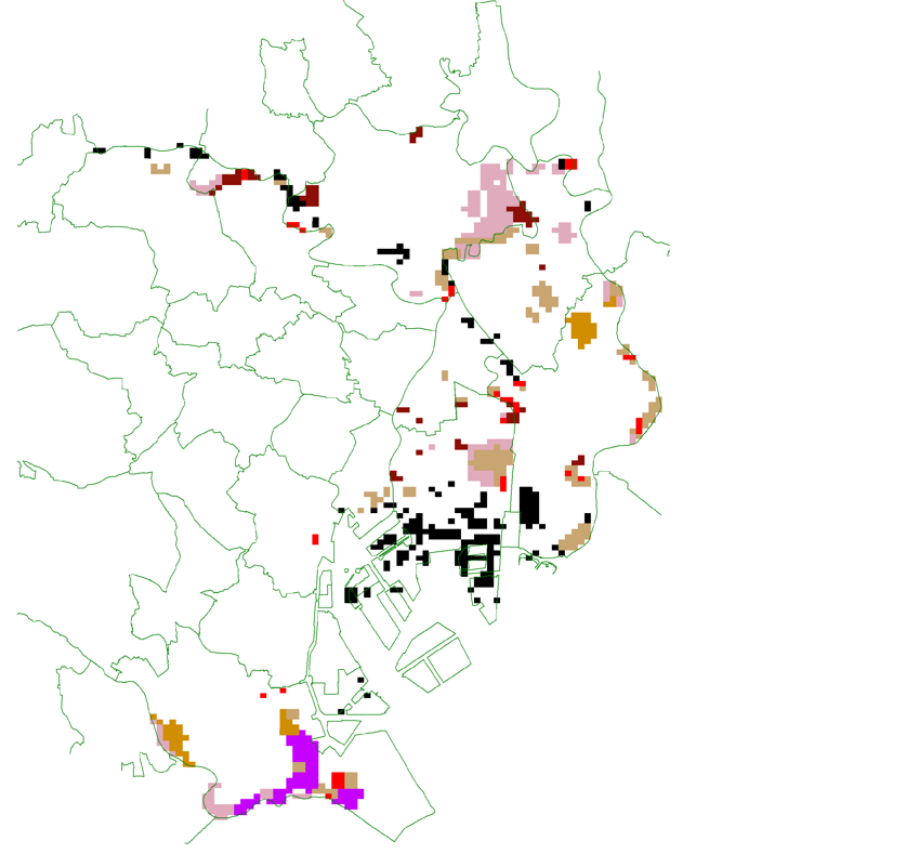
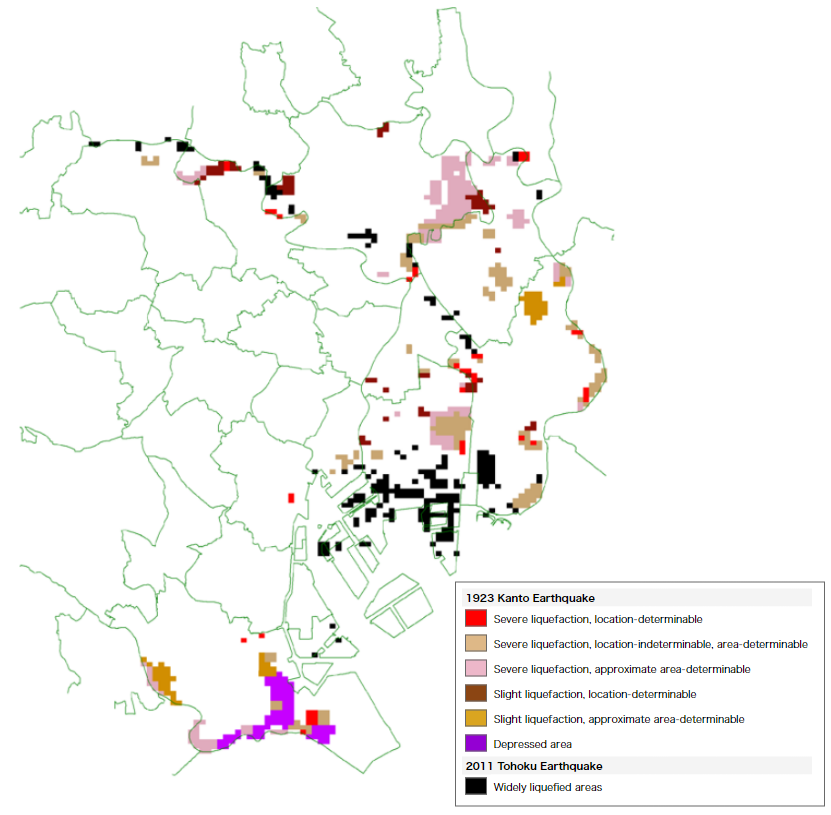
Figure 6 shows a liquefaction history map which provides one of the most important map information as it indicates cases of reliquefaction at once liquefied sites and includes the following information:
- Liquefied areas during the 1923 Kanto earthquake based on interviews and questionnaires of residents who experienced the incident as reported in “Liquefaction Potential Map in Tokyo Lowland” by the Tokyo Metropolitan Civil Engineering Research Institute, 1987.
- Liquefied and depressed areas during the 1923 Kanto earthquake reported in “Reconnaissance Survey Report of the Kanto Earthquake” by the Former Geological Survey of Japan, Ministry of Agriculture and Commerce, 1925.
- Liquefaction caused by the 2011 Tohoku earthquake from survey reports on liquefaction damage by the Tokyo Metropolitan Government and public data from the National Research Institute for Earth Science and Disaster Resilience.
| 1923 Kanto Earthquake | |
|---|---|
| Severe liquefaction, location-determinable | |
| Severe liquefaction, location-indeterminable, area-determinable | |
| Severe liquefaction, approximate area-determinable | |
| Slight liquefaction, location-determinable | |
| Slight liquefaction, approximate area-determinable | |
| Depressed area | |
| 2011 Tohoku Earthquake | |
| Widely liquefied areas | |
Figure 6 Liquefaction history map (displayed by a 250 meter square grid)
◆ (2)Land Condition Map
The land condition map is a kind of landform classification map illustrating the distribution of landform units such as delta, flood plain, natural levees, plateaus, and terraces. It has been pointed out that liquefaction is strongly related to landform units, especially in lowland areas. The liquefaction effects in every landform classification unit is determined as shown in Table 3, which is consistent with the case study of liquefaction during the 1923 Kanto earthquake.
Table 3 The potentiality of Liquefaction Effects by Landform Classification
| Landform Classification Units | ||
|---|---|---|
| Potential of Liquefaction Effects | High |
|
| Moderate |
|
|
| Low |
|
|
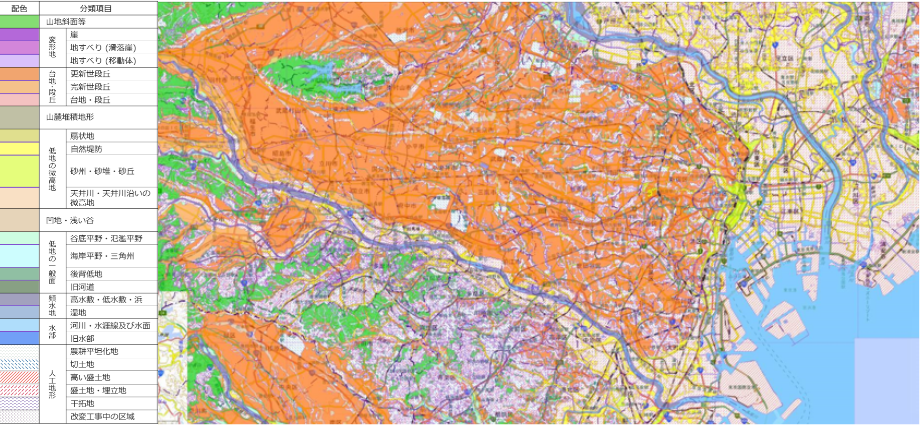
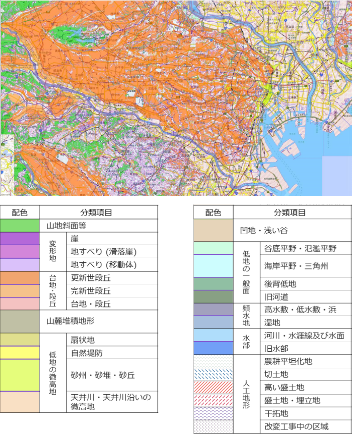
Figure 7 Land condition map (2016 version) by Geospatial Information Authority of Japan
◆ (3)Water Area Transition Map
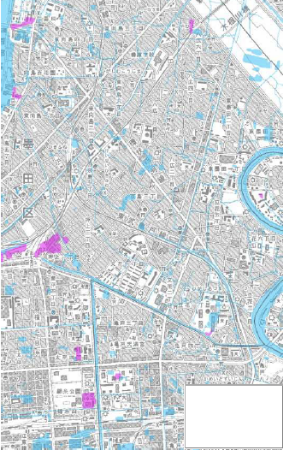
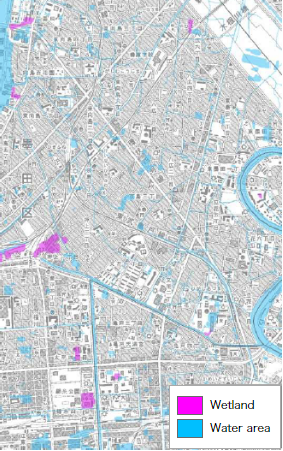
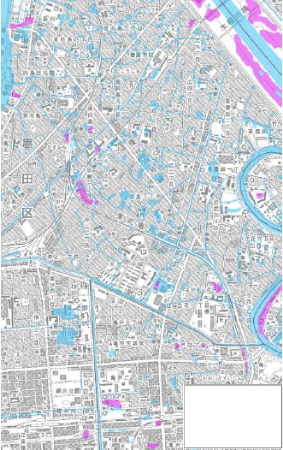
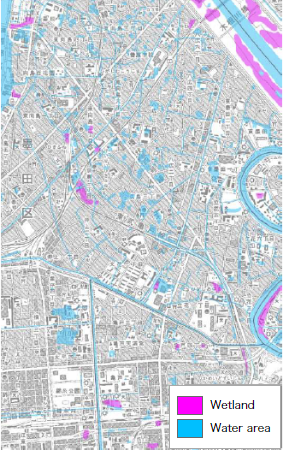
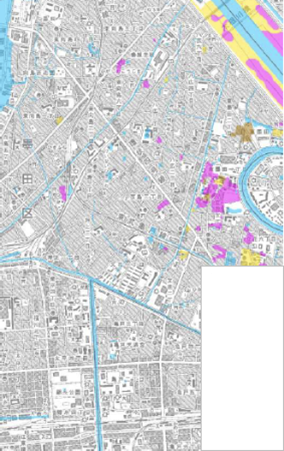
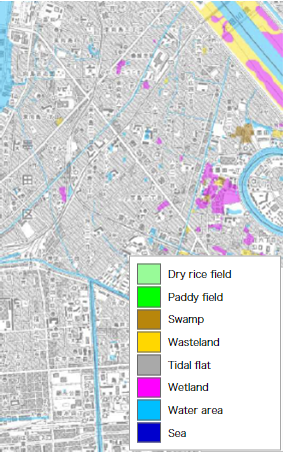
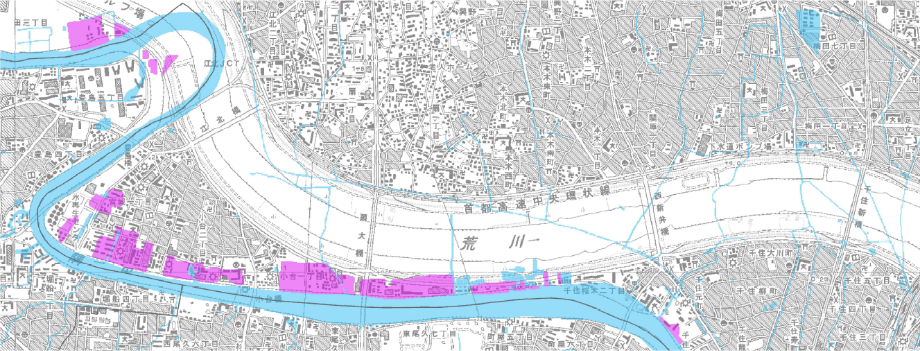
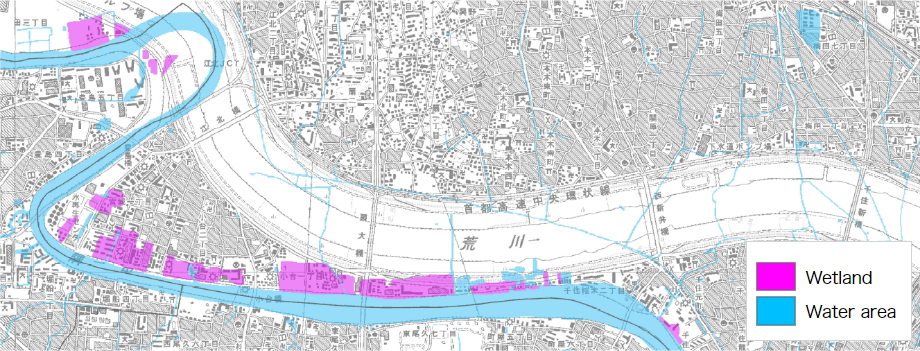
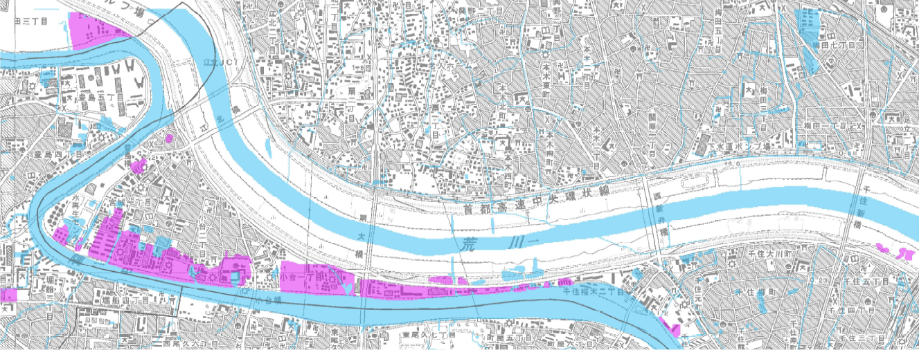
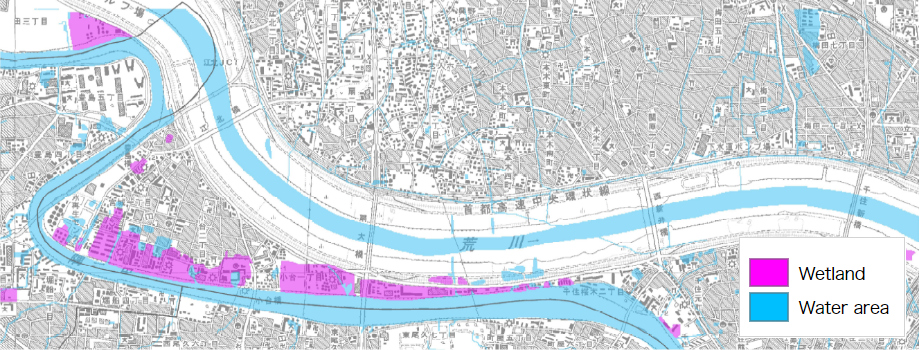
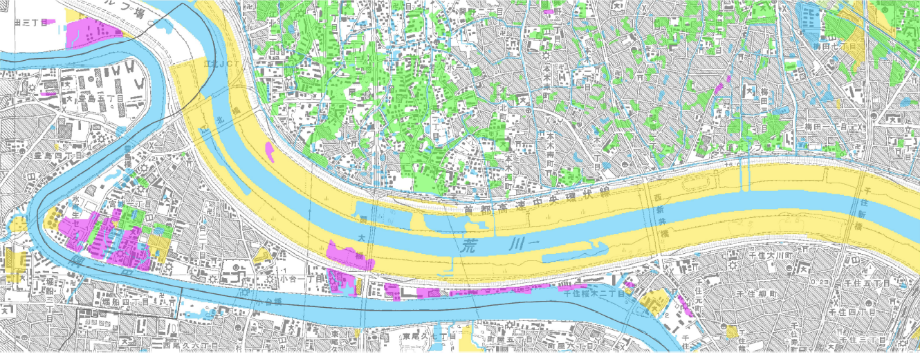
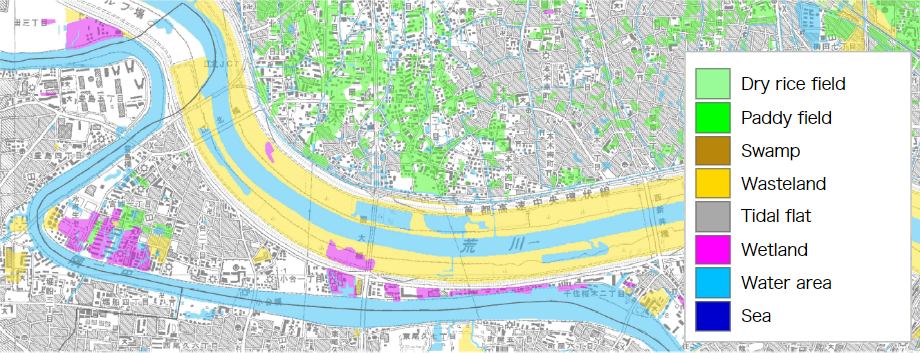
The Water area transition map depicts water areas, wetlands, and tidal flat extracted from topographic maps of the Meiji, Taisho, and Showa eras. Former water areas such as sea, river channels, and ponds may have the potential of liquefaction effects if they are filled with sandy soil.
1909 (Meiji era)
| Wetland | |
| Water area | |
1925 (Taisho era)
| Wetland | |
| Water area | |
1937 (Showa era)
| Dry rice field | |
| Paddy field | |
| Swamp | |
| Wasteland | |
| Tidal flat | |
| Wetland | |
| Water area | |
| Sea | |
Figure 8 Examples of changes in Water areas during the Meiji, Taisho, and Showa eras (Part 1)
Vicinity of Sumida Ward (background: current topographic map)
1909(Meiji era)
| Wetland | |
| Water area | |
1925(Taisho era)
| Wetland | |
| Water area | |
1937(Showa era)
| Dry rice field | |
| Paddy field | |
| Swamp | |
| Wasteland | |
| Tidal flat | |
| Wetland | |
| Water area | |
| Sea | |
Figure 9 Examples of changes in Water areas during the Meiji, Taisho, and Showa eras
(Part 2)
Southwest Adachi Ward (background: current topographic map)
◆ (4)Wetland and Paddy Field Distribution Map
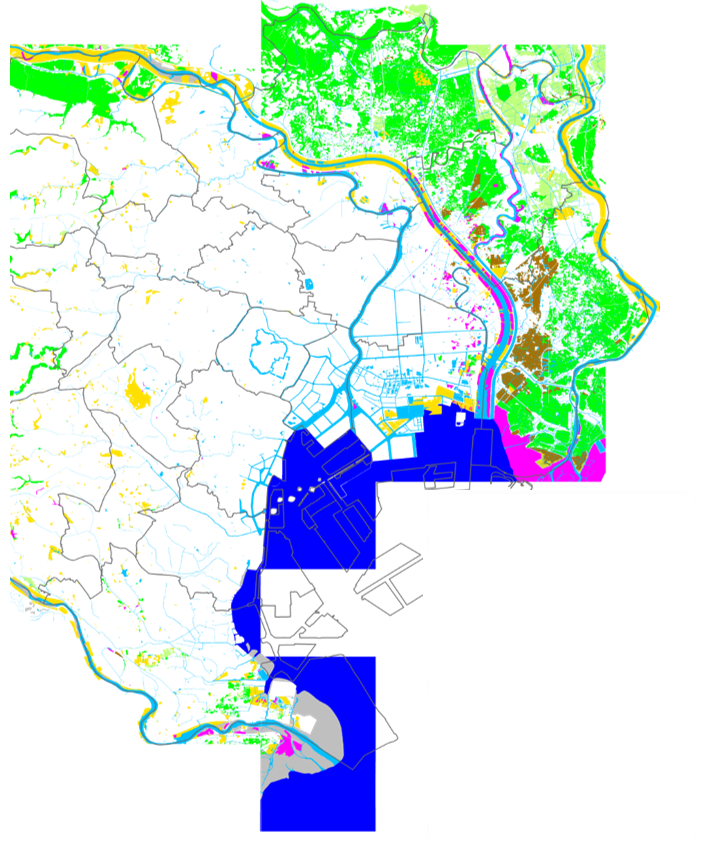
It was shown the occurrence and non-occurrence rate of liquefaction in wetlands is higher in comparison of the area of liquefied, at the Great Kanto Earthquake, divided into wetlands, paddy fields, dry paddy fields and others (farmland, urban area, vacant land, road and water area etc.) by rapid mapping. (refer to※).
※ Tokyo Metropolitan Government Civil Engineering Research Institute : Liquefaction Potential Map of Tokyo low lands,pp.161-162,1987.
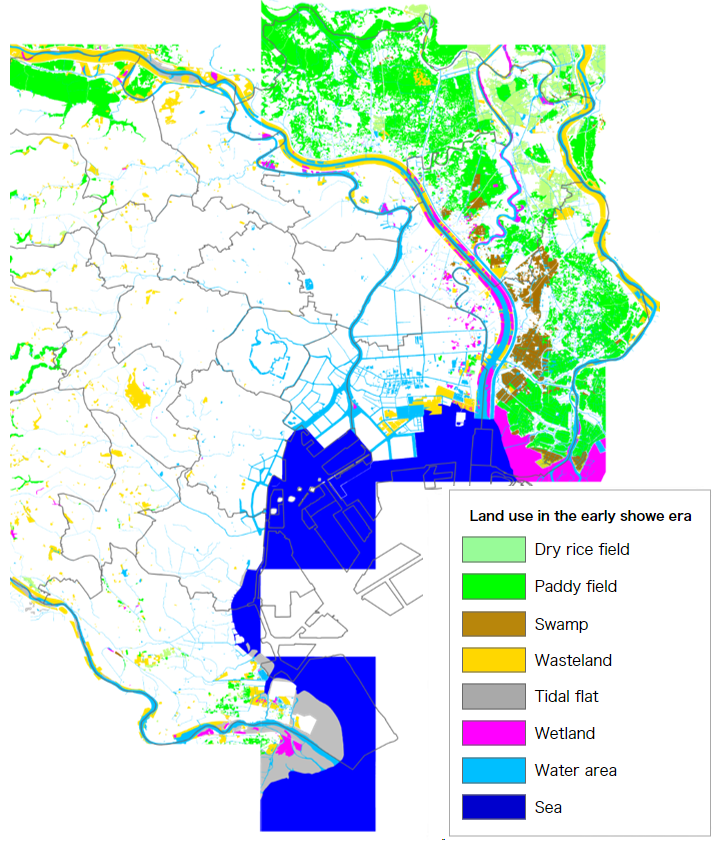
| Land use in the early showe era | |||
|---|---|---|---|
| Dry rice field | |||
| Paddy field | |||
| Swamp | |||
| Wasteland | |||
| Tidal flat | |||
| Wetland | |||
| Water area | |||
| Sea | |||
Figure 10 Distribution of Water Area,Wetland, and paddy fields
◆ (5)Landfill Material Classification Map
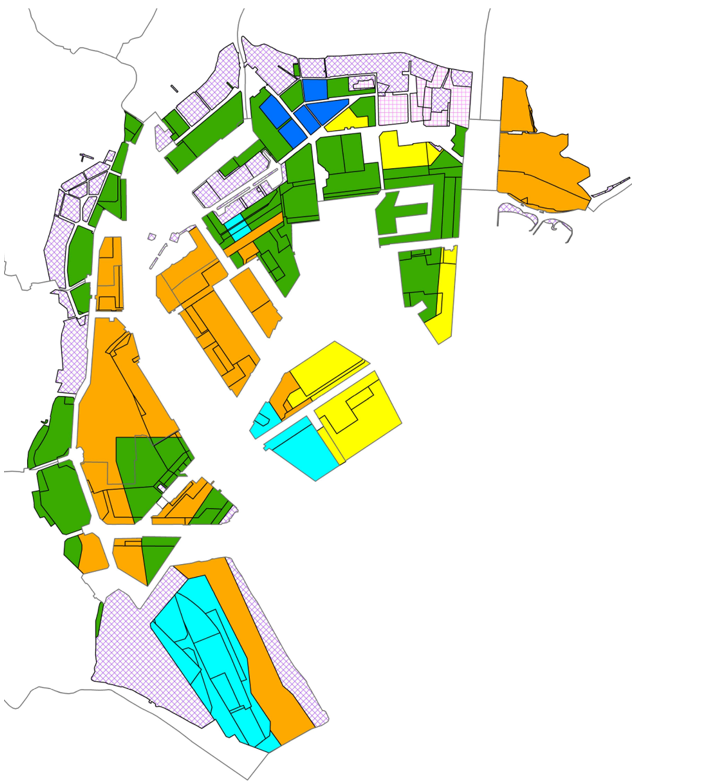
In the Tokyo Bay area, landfill materials are considered different by the sections and ages of the reclamation. So, the liquefaction possibility is determined by a landfill material classification map (Figure 11) complied the sections and ages.
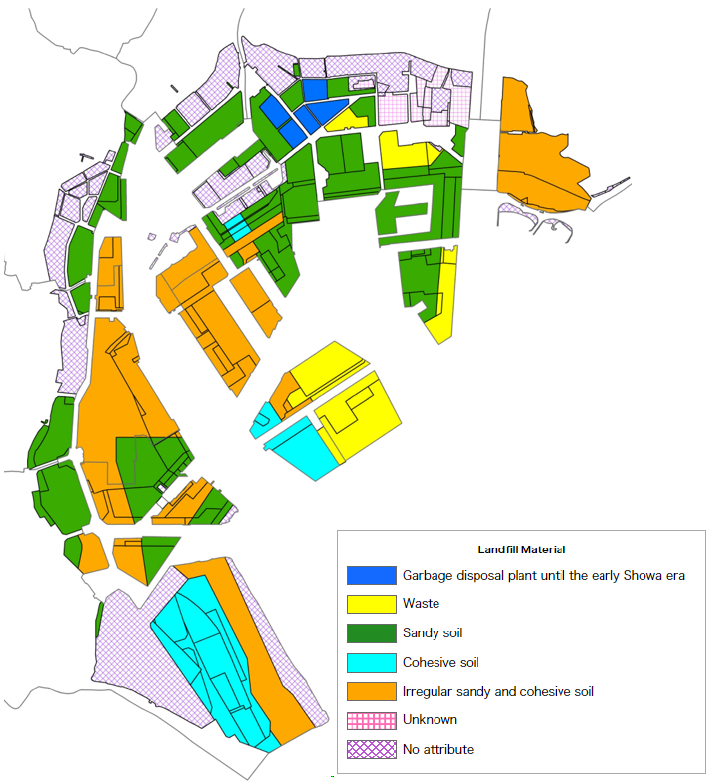
| Landfill Material | |||
|---|---|---|---|
| Garbage disposal plant until the early Showa era | |||
| Waste | |||
| Sandy soil | |||
| Cohesive soil | |||
| Irregular sandy and cohesive soil | |||
| Unknown | |||
| No attribute | |||
Figure 11 Landfill Material Classification Map
8.Overall Judgment of Liquefaction Effects Assessment
The final assessment of liquefaction effects is determined at three levels (high, moderate, and low) for each grid square (refer to the next section) by combining “6. Assessment of Liquefaction Effects by the Liquefaction Resistance Factor FL and the Liquefaction Potential Index PL” and “7. Assessment of Liquefaction Effects Based on Map Information” The overall Judgment of the assessment is as follows:
- A grid square with liquefaction history is considered “high potential for liquefaction.”
- The liquefaction potential of the grid square without borehole data is determined only from map information.
-
Other than“1”and“2”as above, cross-assessment applies as follows:
- If the results of the assessments by borehole data and map information are the same, both are adopted.
- If the results of the assessments by borehole data and map information differ by one rank, the one with the higher assessment result (potential of liquefaction) is adopted.
- If the results of the assessments by borehole data and map information differ by two ranks, an intermediate assessment between the two (moderate potential for liquefaction) is adopted.
9.Presentment of Liquefaction Potential
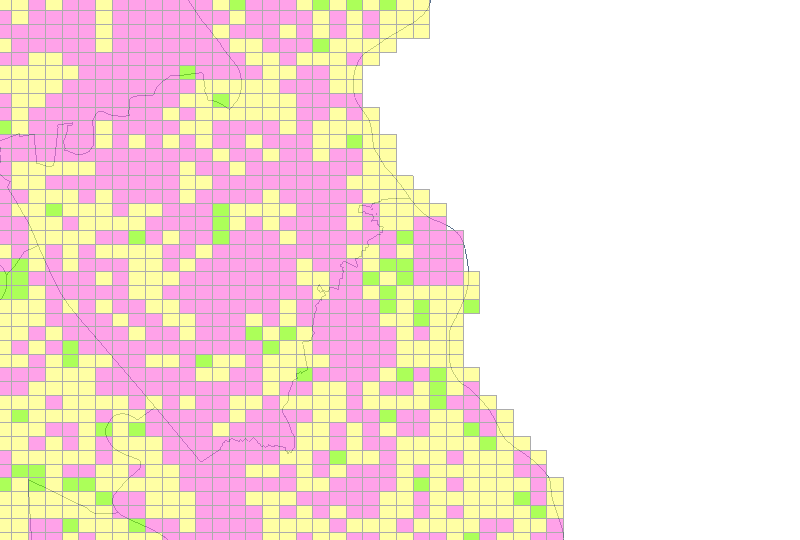
The liquefaction potential map is based on a 250 meter square grid in accordance with the 1973 Administrative Management Agency notice. The assessment result represents the average liquefaction potential of the area included in the grid square. Each grid square is color-coded according to the level of assessment as shown in Figure 12:
| Degree of Liquefaction Potential | |
|---|---|
| High | |
| Moderate | |
| Low | |
Figure 12 Example of liquefaction effect potential map

